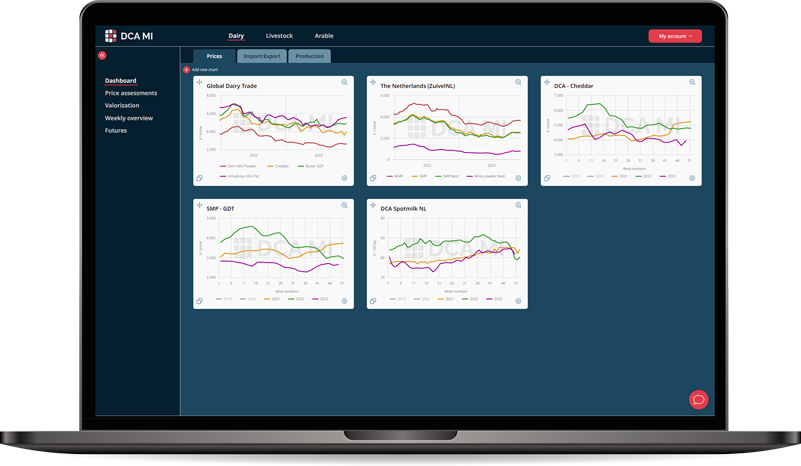
To analyse data.
Go to Commodities
Select a product (max three per chart)
To edit the chart click on Menu at the top left corner of the chart
Here you have the following options
- Save the chart
- Add the chart to your dashboard
- Export the data from the chart to Excel (Enterprise subscription only)
- Make a screenshot
- Delete the chart
- Edit the chart
- Change the settings of the chart under general settings
- Or change the settings of the product by selecting this item
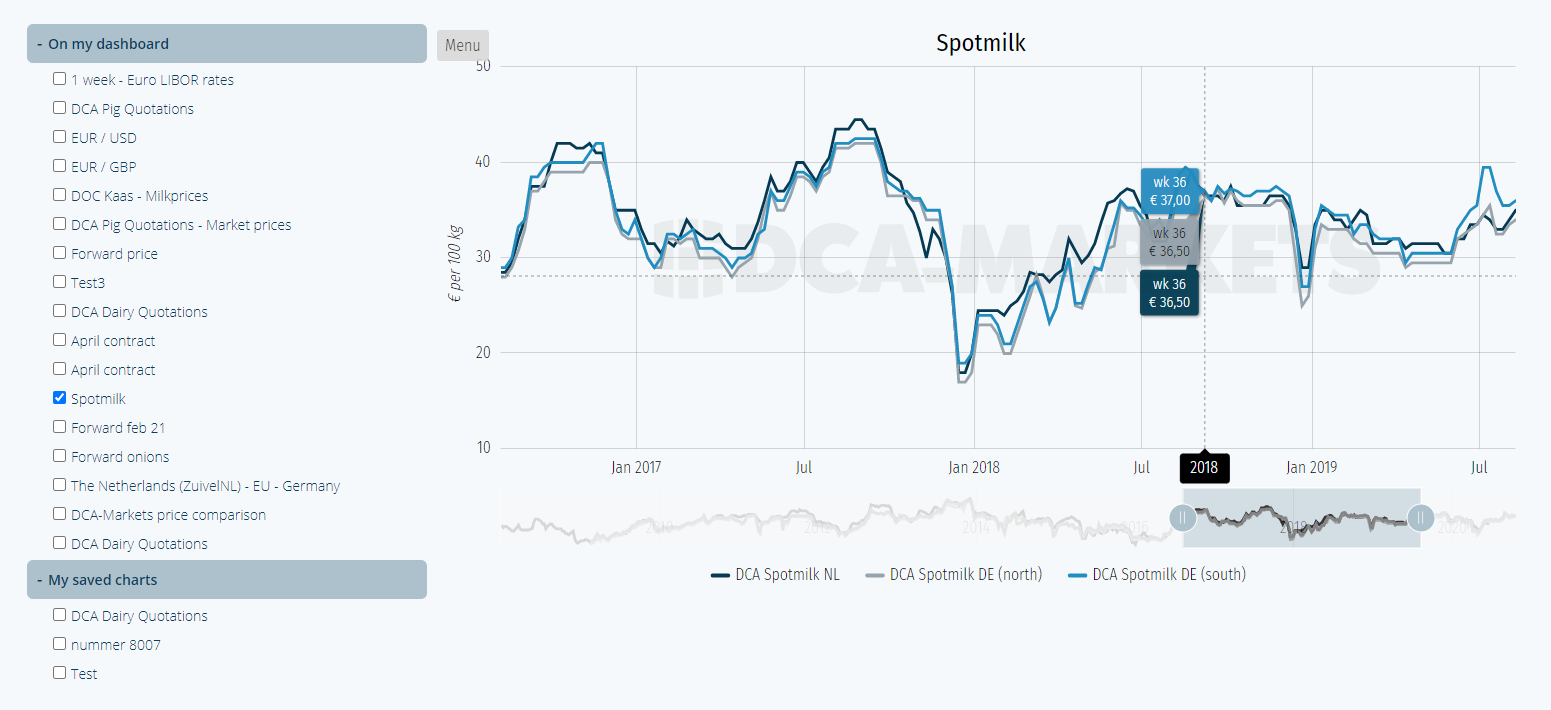
You are able to see your saved graph by clicking on the Menu on the top right hand side and select My charts. Then you see the saved charts and the charts that have been put on your dashboard. Here you can quickly switch between the charts of most importance to you.
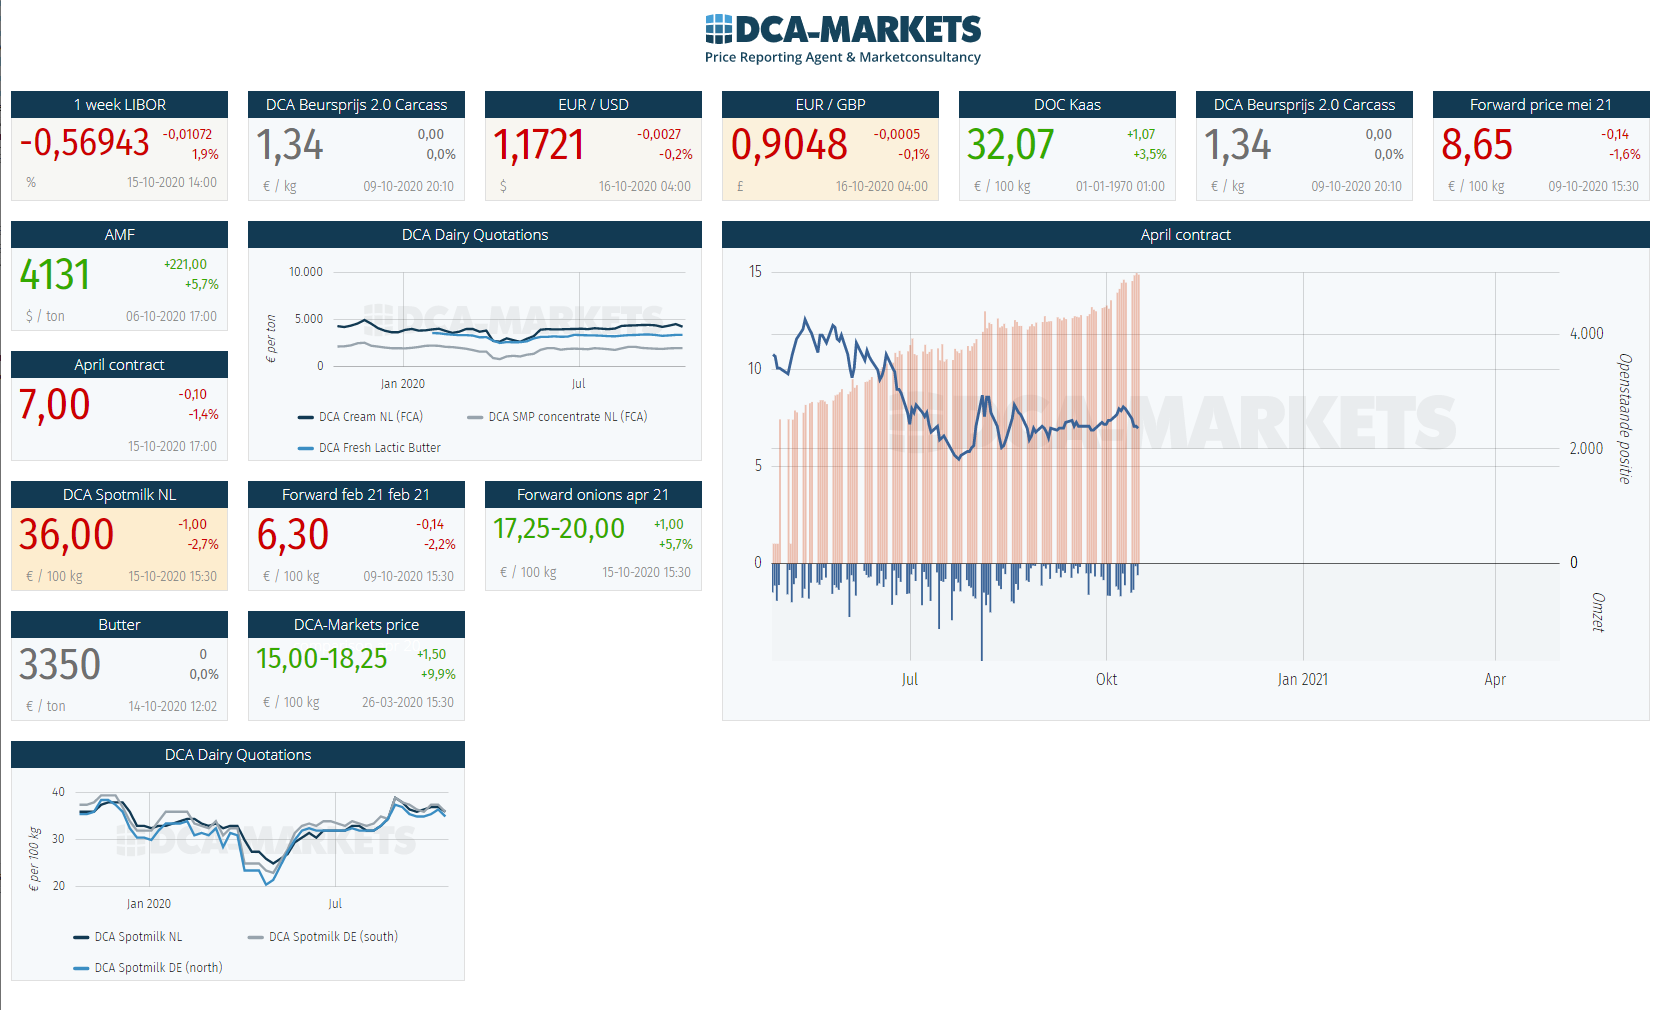
You are able to see your dashboard by clicking on the menu on the top right hand side and select My dashboard.
You can edit your dashboard using the Edit dashboard button. You can move the panels around the grid and adjust the size by clicking the + or - button.
Save to confirm the (new) setting.
When you double click on a panel the saved chart opens for further analysis. Note that you can not add an additional product here.